Seattle Public Schools real spending per student is up about 47% since 2011–12
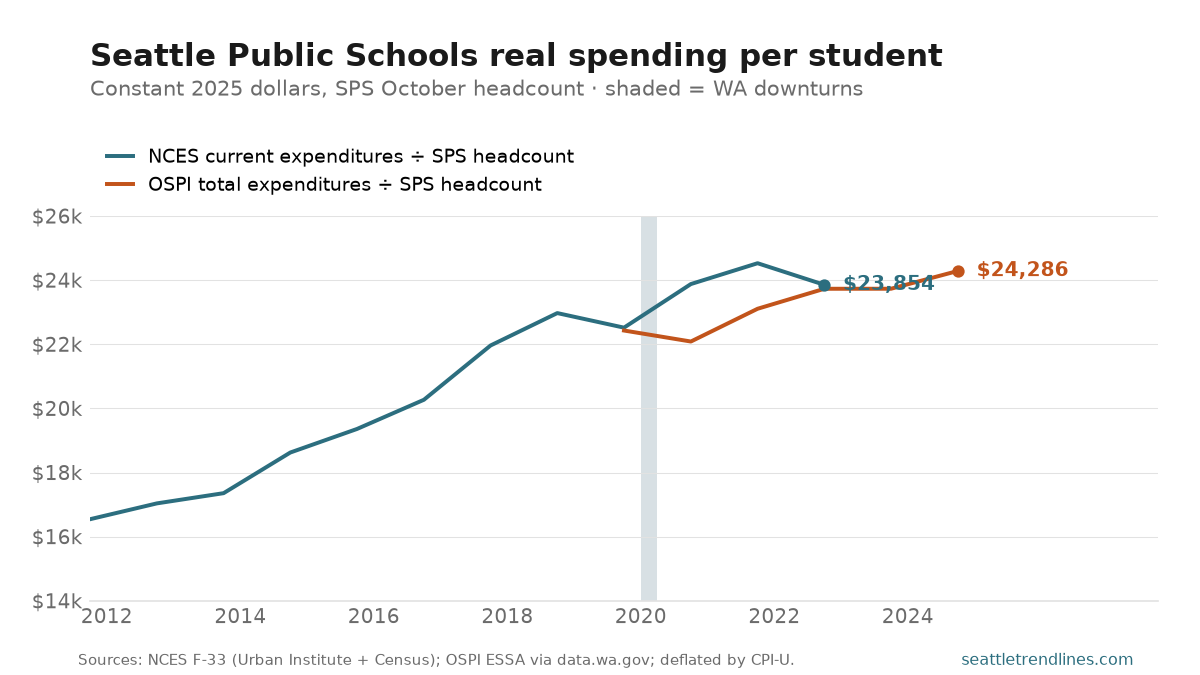
Measured against the district’s own October headcount, real spending per pupil climbed from about $16,500 in 2011–12 to $24,286 in 2024–25 (constant 2025 dollars) — roughly a 47% real increase, driven by the post-McCleary funding surge of the mid-2010s, with growth cooling since.
The shaded band is where the two independent sources overlap (2019–20 through 2022–23). At both ends of that window they agree almost exactly — within 0.4% in 2019–20 and 0.5% in 2022–23. In between, the federal NCES “current spending” line jumps 6–8% above the state’s ESSA-based line: that’s the wave of pandemic ESSER relief, which the NCES measure books in full while OSPI’s ESSA figure excludes part of it. By 2022–23, with relief winding down, the two reconverge. It’s a clean illustration that which spending definition you use matters most exactly when a one-time funding shock hits. (Y-axis starts at $14,000.)
The two measures, and why use both:
NCES current expenditures ÷ SPS headcount. Federal F-33 operating expenditures (Urban Institute through 2019–20, U.S. Census Bureau for 2020–21 to 2022–23), over SPS’s October count. Plus: a standardized, nationally comparable definition with a long back-run; the two F-33 sources match within 0.2% where they overlap. Minus: still released with a lag (ends 2022–23), and it fully books one-time federal surges like ESSER.
OSPI total expenditures ÷ SPS headcount. Washington’s ESSA expenditure total over the same headcount. Plus: state-official and current through 2024–25. Minus: ESSA accounting excludes some spending (so it understates the ESSER years), and it only begins in 2019–20.
Using SPS headcount as the common denominator (rather than NCES fall membership or OSPI’s annual-average FTE) raises the per-pupil figure by roughly 3% and is the most locally meaningful count — but it’s why this view starts in 2011–12, the first year of consistent district headcount.
Sources: NCES Common Core of Data district finance survey (F-33), current expenditures, via the Urban Institute (through 2019–20) and the U.S. Census Bureau School System Finances API (2020–21 to 2022–23); OSPI ESSA per-pupil expenditure (total expenditures, data.wa.gov, 2019–20 to 2024–25); both divided by SPS October headcount. Deflated by BLS CPI-U (annual average). Overlap agreement: 2019–20 +0.4%, 2022–23 +0.5%; pandemic years 2020–21 +8.1%, 2021–22 +6.1%. Annual; OSPI posts the new school year each winter (2025–26 expected early 2027).