Seattle–Tacoma container volume fell again in 2025, to 22% below its 2018 peak
The Ports of Seattle and Tacoma compete no longer: in 2015 they merged their marine-cargo operations into The Northwest Seaport Alliance (NWSA), which since then reports the two harbors as one gateway. So this is a single combined line — there is no public Seattle-versus-Tacoma container split after 2015.
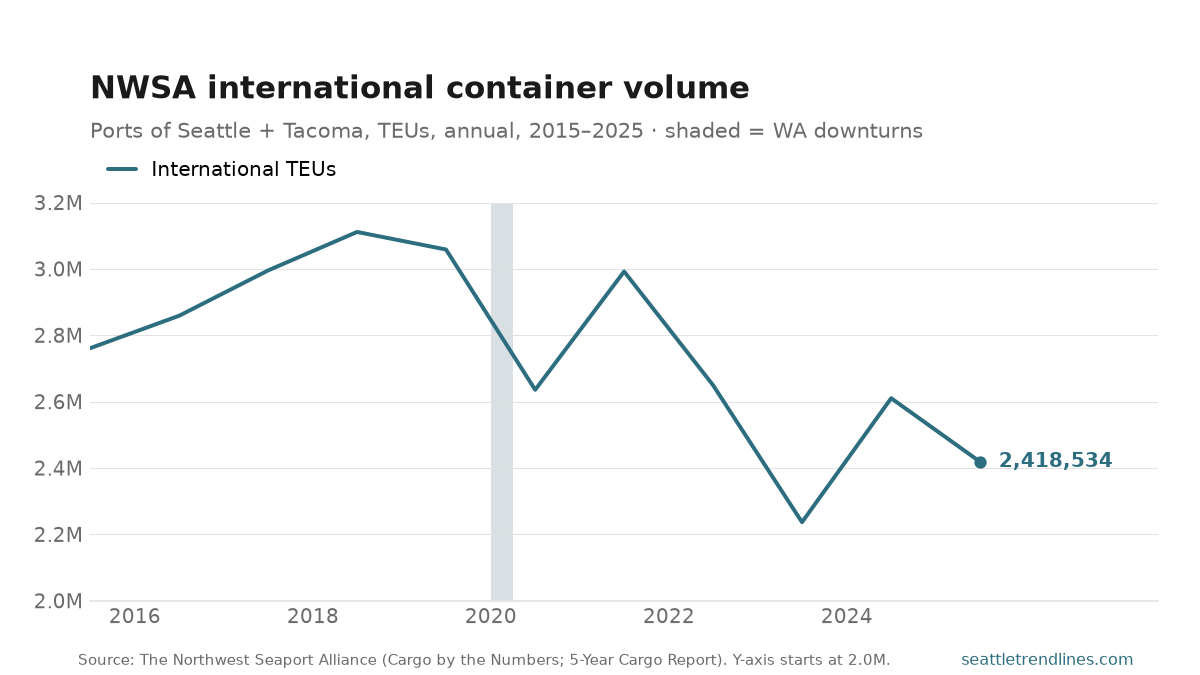
NWSA handled 2,418,534 international TEUs in 2025, down 7.3% from 2024. That is the second-lowest annual total since the 2015 merger — above only the 2.24 million trough of 2023 — and it leaves container volume 22% below the 2018 peak of 3.11 million and 13% below where it stood in 2015.
The shaded band marks Washington’s only economic contraction of the period, the early-2020 COVID downturn. Unlike the city’s population, the docks felt it: international volume dropped 13.8% in 2020. It then snapped back in the 2021 import boom to 2.99 million, before three of the next four years moved lower as imports normalized and 2025’s tariff pressure and elevated retail inventories cut into the full-container trade.
Splitting the loaded boxes apart shows two different stories.
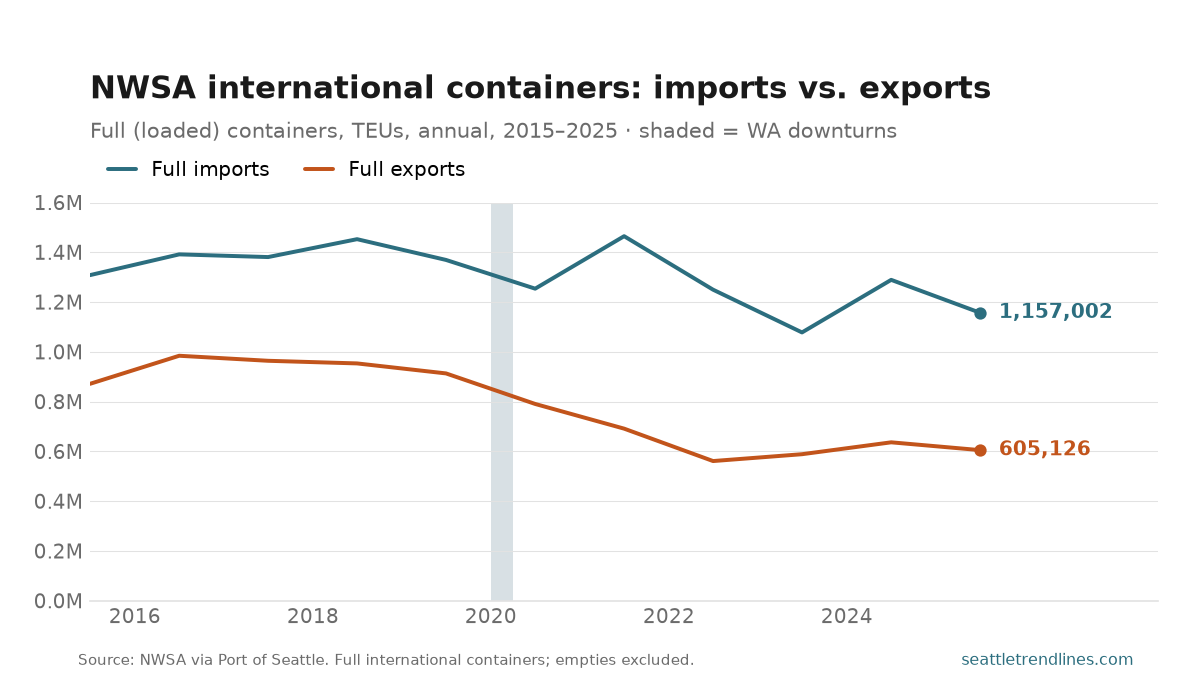
Full imports have held in a 1.1–1.5 million band: they spiked to 1.46 million in the 2021 import boom, then unwound, falling 10.3% in 2025 to 1,157,002. Full exports have done something more durable — drifted down for a decade, from a 2016 peak of 984,274 to 605,126 in 2025 (−4.9% on the year), a 39% slide from that peak. The result: the gateway’s import-to-export ratio has widened from 1.5 in 2015 to 1.9 today, and in recent years NWSA now ships back more empty boxes than it fills with exports.
Two caveats on the number. It counts international containers only — full imports, full exports, and empties — and excludes domestic Alaska and Hawaii traffic of roughly 0.73 million TEU a year; including it, NWSA’s 2025 grand total was about 3.16 million, down 5.5% on the year. And because the ports report jointly, the long Seattle-versus-Tacoma rivalry that ran through the 1990s and 2000s can no longer be drawn as two lines.
Source: The Northwest Seaport Alliance — Cargo Statistics; 10-year international series via Port of Seattle, “NWSA Cargo by the Numbers” (2015–2024) and the NWSA 5-Year Cargo Report (2025). State downturns: Philadelphia Fed Coincident Economic Activity Index for Washington via FRED. Annual; NWSA reports the 2026 full-year total in early 2027.