Seattle-area real GDP grew 6.2% in 2023 — the fastest of any big U.S. metro
The Seattle metro economy — King, Snohomish, and Pierce counties — produced $488 billion of real output in 2023, the most recent year the Bureau of Economic Analysis publishes for metro areas. That is up 6.2% from 2022, which the BEA ranked as the fastest growth of any U.S. metro with more than 1.5 million people (Houston was next, at 5.4%). Information and tech alone generated $133.7 billion of it.
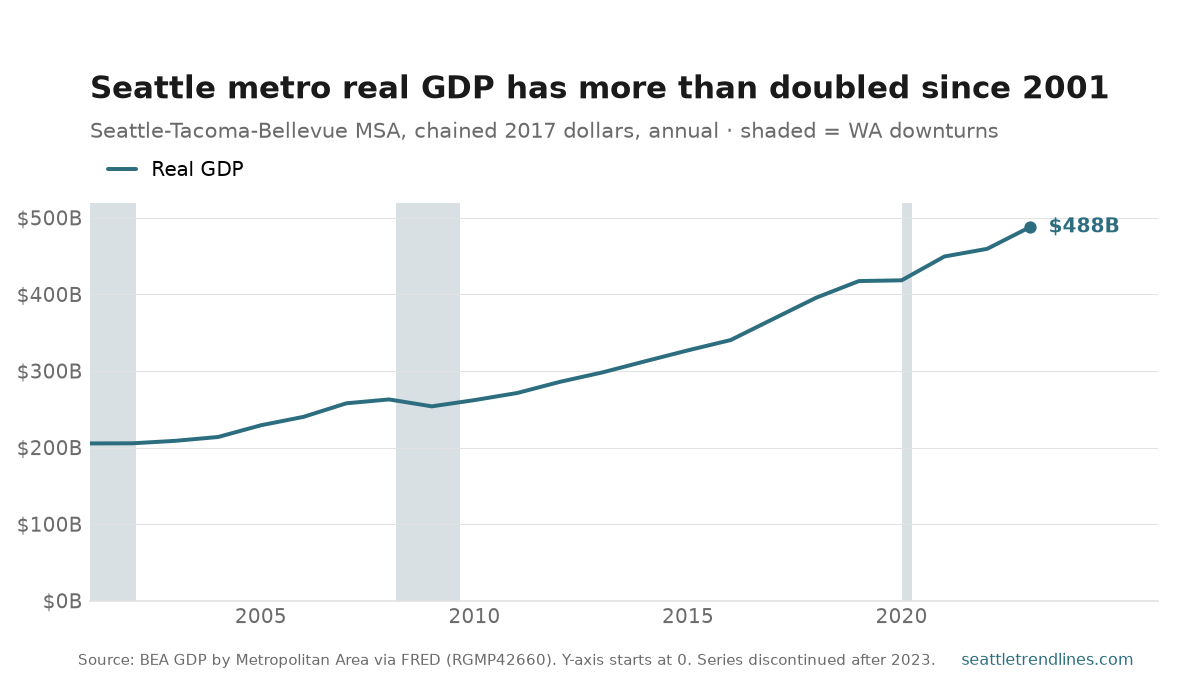
Real output has grown 2.4-fold since 2001, from $205 billion. The line bends upward after 2016: the cloud-and-Amazon stretch of 2017–2019 added real growth of 8.2%, 7.5%, and 5.5% in consecutive years, the strongest run in the series.
What stands out against the shaded bands is how little the contractions bit. The 2001 dot-com bust — which hit tech towns hard — left Seattle’s real GDP essentially flat (about +0.1% in both 2001 and 2002) rather than shrinking. The only outright annual decline in twenty-three years came in 2009, down 3.4% in the Great Recession, and it was erased by 2011.
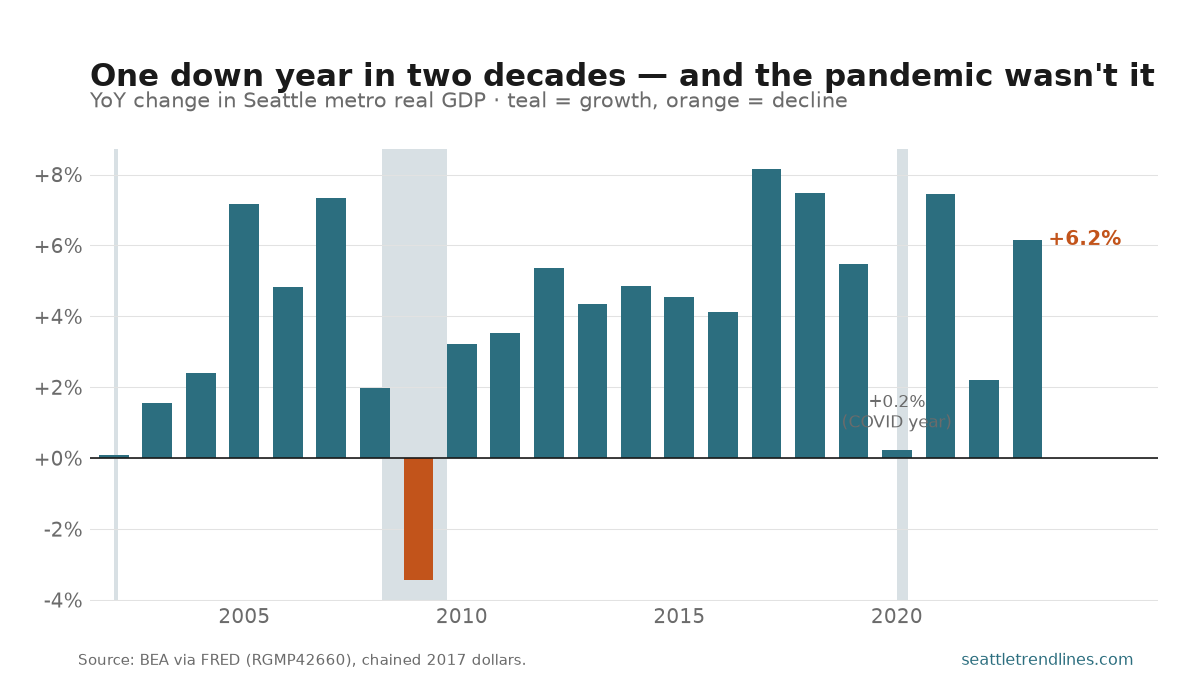
The pandemic is the real tell. Most metros’ output fell in 2020; U.S. real GDP dropped about 3.5% that year. Seattle’s rose 0.2% — flat, but on the right side of zero — because the things that power this economy (cloud services, software, e-commerce logistics) were precisely the things that boomed while people stayed home. Growth then resumed at 7.4% in 2021.
Two caveats. This is real GDP in chained 2017 dollars, so the doubling is genuine output growth, not inflation; in current dollars the 2023 figure is a larger-looking $566.7 billion. And 2023 is the end of the line: the BEA has discontinued its metropolitan-area GDP series, so there is no official 2024 or 2025 metro number to add — only the underlying county estimates, released on a lag.
Source: U.S. Bureau of Economic Analysis, GDP by Metropolitan Area (real GDP, all industries, chained 2017 dollars), accessed via FRED series RGMP42660 (real) and NGMP42660 (nominal). Geography: Seattle-Tacoma-Bellevue, WA MSA (CBSA 42660 = King, Snohomish, and Pierce counties). The “fastest among large metros” ranking and the $133.7B tech/information figure are from BEA’s December 4, 2024 release, as reported by Axios Seattle. State downturns: Philadelphia Fed Coincident Economic Activity Index for Washington via FRED. Annual; BEA released 2023 metro estimates in December 2024 and has since paused MSA-level publication.