Seattle’s tech jobs fell for three years; leisure and hospitality is now the bigger employer
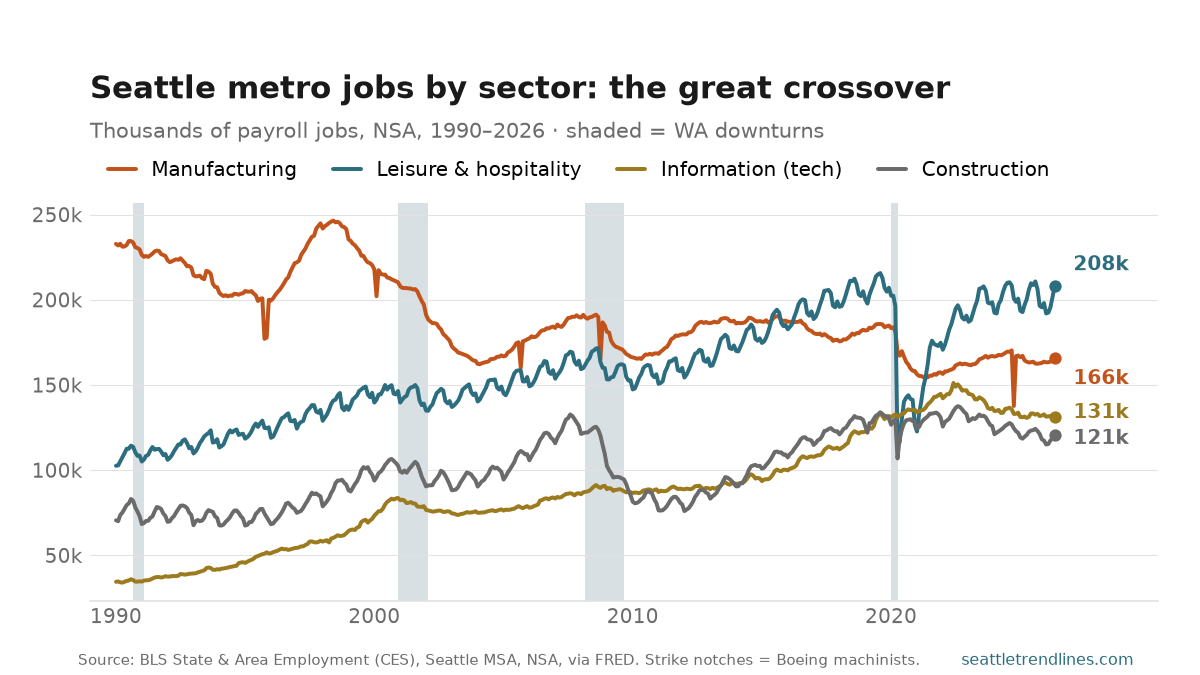
Thirty-six years ago, the Seattle metro economy was a manufacturing town: Boeing and its suppliers employed about 233,000 people in 1990, while the Information sector — software, publishing, telecom, the bucket that holds “tech” — was a rounding error at 34,500. Those two lines have spent a generation converging, and a third, leisure and hospitality, has quietly passed them both.
The story in one chart. Manufacturing (the Boeing cycle) has lost about a third of its 1990 workforce, sliding to 165,800 by May 2026; the violent single-month notches in 1995, 2005, 2008, and again in October 2024 are machinist strikes, visible because this series is not seasonally adjusted. Information climbed almost without interruption for thirty years — the Microsoft-then-Amazon ascent — peaking near 151,000 in mid-2022. It then fell for three consecutive years to the low 130s, off roughly 13% from that peak: the local fingerprint of the 2023–2025 tech retrenchment. Leisure and hospitality took the hardest pandemic hit of any sector, collapsing from about 202,000 to 114,400 in a single month in spring 2020, but it has not only recovered — at a record 208,200 it is now the largest of these four, having overtaken a diminished manufacturing sector around 2015. Construction remains the cyclical one, up from 71,000 in 1990 to 120,900 but well off its 2022 high as higher rates bit — the permit slump made flesh.
Year over year the picture matches the stalled total: payrolls were 2.14 million in May 2026, flat on the year. Manufacturing (+1.6%) and leisure (+1.2%) edged up, construction fell 1.3%, and information was essentially unchanged (−0.1%) — which, after three years of decline, is itself a kind of news: the tech slide has stopped, at least for now.
A note on the construction line: FRED discontinued the seasonally-adjusted Seattle-MSA construction series at the end of 2024, so this is the mining, logging, and construction supersector, not seasonally adjusted. In this metro, mining and logging are negligible, so the line reads as construction.
Source: U.S. Bureau of Labor Statistics, State & Area Employment (CES), Seattle–Tacoma–Bellevue MSA, not seasonally adjusted, via FRED — Information, Manufacturing, Mining/Logging/Construction, Leisure & Hospitality, Total nonfarm. State downturns: Philadelphia Fed Coincident Index for Washington. Monthly, about three weeks after month-end; this chart refreshes on the next daily build.