Fremont Bridge bike trips: past the pandemic dip, back over a million
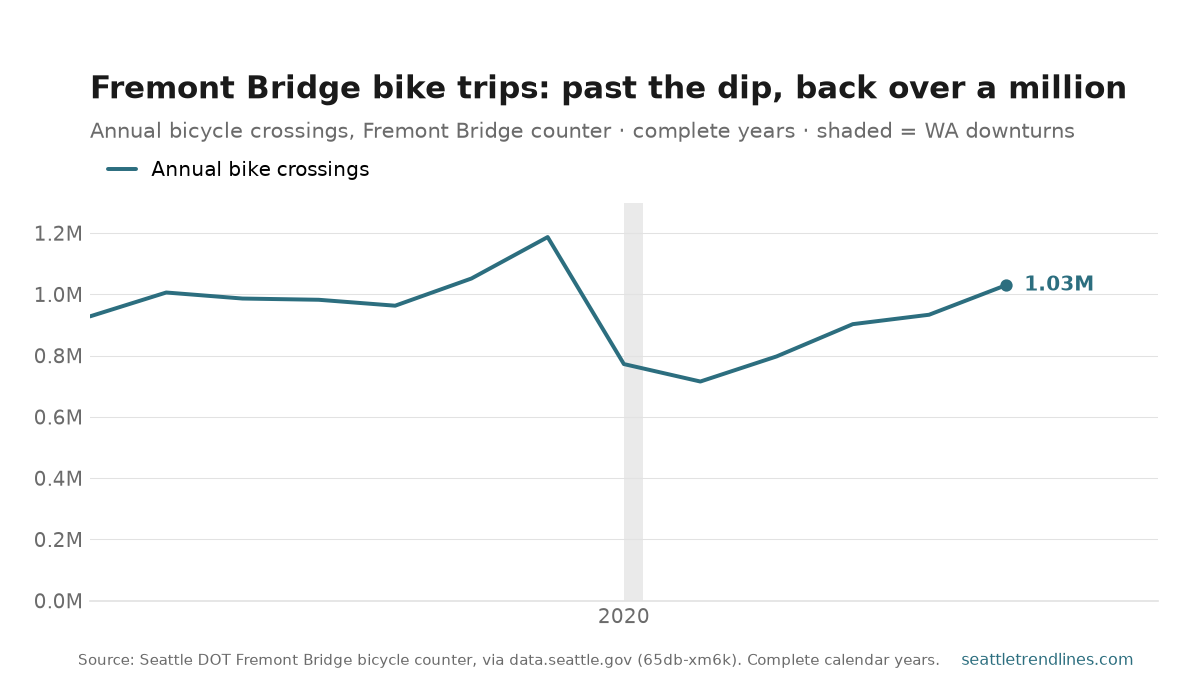
The Fremont Bridge counter is the closest thing Seattle has to a heartbeat monitor for cycling: an inductive loop in the deck that has tallied every bike crossing, hour by hour, since it went live in October 2012. Aggregate those hours into calendar years and you get one of the cleanest behavioral time series in the city — no survey, no sampling, just a count.
The shape tells the story of the past decade. Crossings held just under a million a year through the mid-2010s, then climbed to a peak of about 1.19 million in 2019. The pandemic erased that gain and then some: as downtown offices emptied, the bridge’s commute traffic fell to roughly 715,000 by 2021, a drop of nearly 40% from the peak. What’s notable is what came next — a steady, four-year climb back, with 2025 crossing back above a million for the first time since 2019.
Read it as a commuting signal as much as a cycling one. The Fremont Bridge carries a heavily commute-oriented flow between north Seattle and the job centers around South Lake Union and downtown, so its collapse and slow recovery track the return-to-office story as closely as any transit series — and more cleanly than most, because a bike counter can’t be revised, reweighted, or reclassified. The number is just the number.
Source: Seattle Department of Transportation, Fremont Bridge Bicycle Counter, via data.seattle.gov (dataset 65db-xm6k). Hourly counts aggregated to complete calendar years; the counter has run since October 2012. Data refreshes on the next daily build. State downturns shaded from FRED WAPHCI.