Washington’s fastest labor-market signal: weekly jobless claims
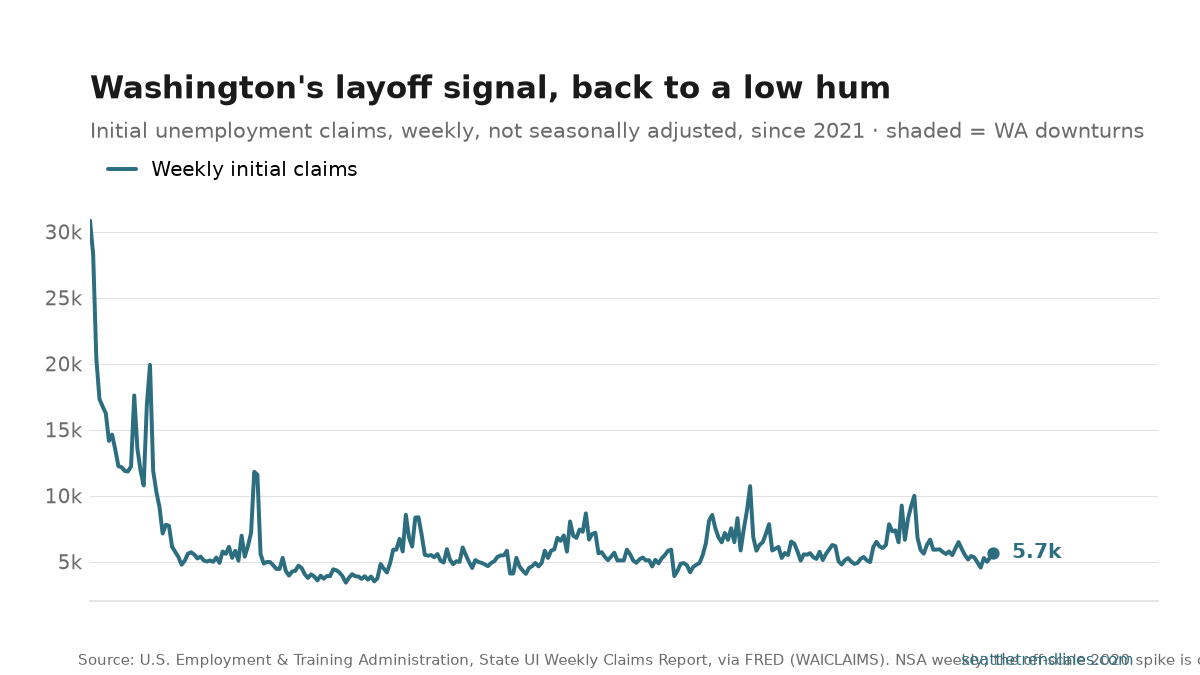
Most labor-market data arrives late. The monthly jobs report lands weeks after the fact; the unemployment rate is a lagging indicator by construction. Initial claims for unemployment insurance are the exception — filed the week someone loses a job, reported every Thursday, no smoothing. When layoffs turn, this is the first series to move.
The chart shows Washington’s weekly initial claims since 2021, past the off-scale spring-2020 spike (the week COVID closures hit, the state logged well over a hundred thousand claims in a single week — a value that flattens everything else if you leave it on the axis). What’s left is the signal that matters: the steady descent from the elevated 2021 readings back toward the low, calm range that defined the late-2010s labor market, and wherever the latest week now sits against it.
Read the level, but respect the noise. These are not seasonally adjusted, so the week-to-week sawtooth is mostly calendar — holidays, school-year edges, seasonal industries — not economic news. The honest way to watch this series is the trend across many weeks, and the direction relative to the same week a year earlier. A single spike is weather; a rising floor over a month or two is the thing to worry about.
Source: U.S. Employment & Training Administration, State UI Weekly Claims Report, via FRED series WAICLAIMS. Not seasonally adjusted; dated to the week ending Saturday. New claims post every Thursday around 5:30 a.m. Pacific; this chart refreshes automatically on the next daily build. State downturns shaded from FRED WAPHCI.