A record at the pump: Seattle gas averages $5.90
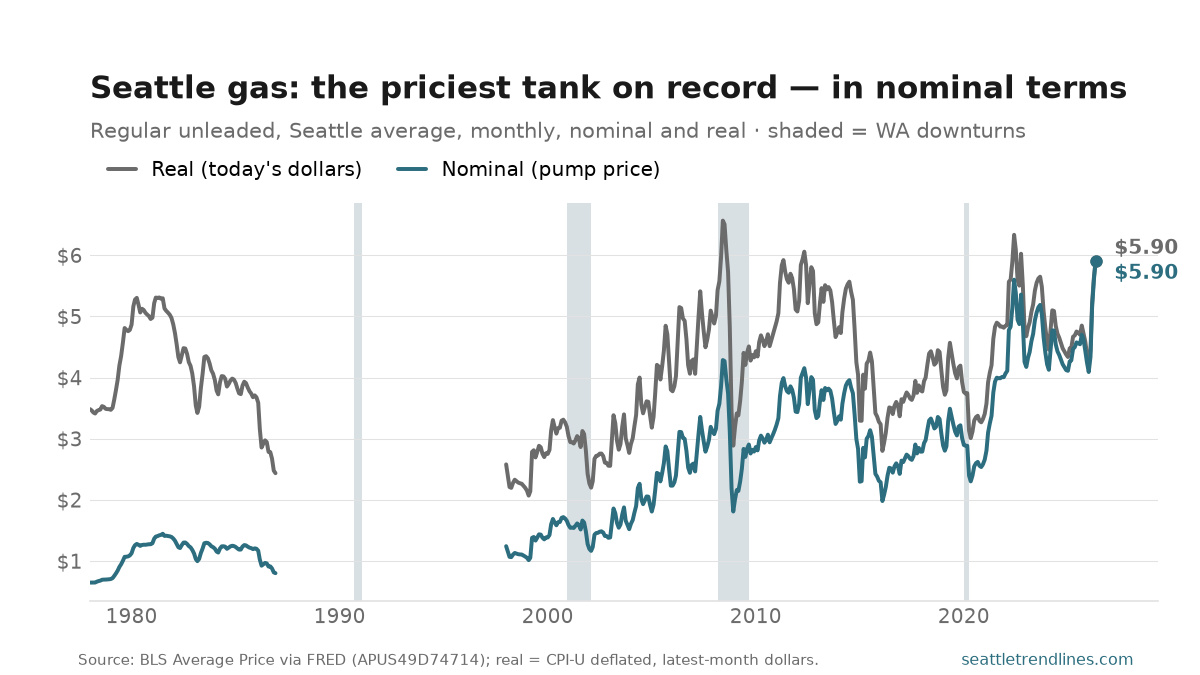
Seattle’s average pump price for regular unleaded hit $5.90 a gallon in May — the highest monthly figure in the 48 years BLS has tracked it, back to 1978, past the old record of $5.60 from June 2022. The run-up was violent: $1.81 in four months (January’s average was $4.09), the steepest four-month climb anywhere in the series — steeper than the ramps into 2008, into 2022, or out of the 1979 oil shock. And May isn’t the end of it — AAA’s daily tracking put King County above $6 in June.
The proximate causes are well documented: the war with Iran and the disruption of tanker traffic through the Strait of Hormuz have pushed crude sharply higher, the permanent closure of Valero’s Benicia refinery has tightened West Coast refining capacity, and Washington’s carbon-allowance program adds an estimated half-dollar per gallon on top. A supply shock landing on the country’s most supply-constrained fuel market, in one of its most heavily taxed states.
The gray line is the caveat that keeps the record honest: in real terms, this is expensive but not unprecedented. Deflated to today’s dollars, gas cost more during the 2008 spike (a peak of $6.57 in June), the 2011–2012 plateau (about $6.06), and the 2022 shock ($6.33 in June). May’s $5.90 sits about 10% under the real 2008 high — a record in the units your credit card sees, not yet in purchasing power. The long view sharpens the point: the 1979–80 oil shock, the last time a Middle East crisis did this to the pump, topped out in 1981 at the equivalent of only about $5.31 in today’s money — below where we are now. What felt ruinous to a driver in 1981 would be a relief today.
Gasoline is also the most visible piece of the broader inflation picture: it’s a small share of spending with an outsized grip on how expensive life feels. Adjusted for inflation, a gallon in 1978 ran about $3.49 — roughly $2.40 less than today’s tank, and a reminder of how much of the “record” is the dollar shrinking rather than gas alone climbing.
Source: U.S. Bureau of Labor Statistics, Average Price Data, gasoline, unleaded regular, per gallon, Seattle-Tacoma-Bellevue, via FRED series APUS49D74714, monthly since January 1978. Monthly average of posted prices — it smooths over the daily swings AAA reports. Real line deflated by U.S. CPI-U (CPIAUCNS) to the latest month. New months post with the CPI release, mid-month; this chart refreshes on the next daily build.