Seattle inflation is back near 5% — and running hotter than the nation
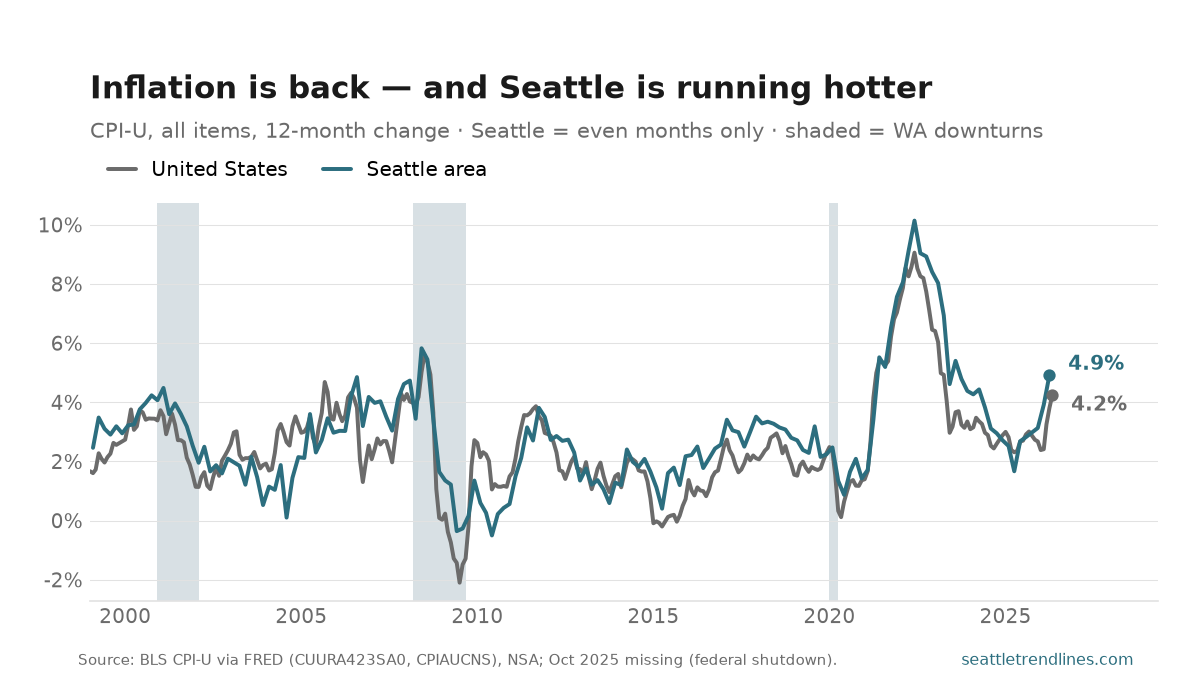
Consumer prices in the Seattle area rose 4.9% over the year through April — the fastest local inflation since November 2022, and the fifth straight reading to come in hotter than the last. The acceleration has been remarkably steady: 2.7% last June, 2.8% in August, 3.1% in December, 3.9% in February, 4.9% now. The U.S. rate is on the same escalator a step behind — 4.2% through May, up from 2.4% as recently as February.
Two things are true at once on this chart. First, the 2026 upturn is a national story with an energy signature — gasoline at record nominal prices does a lot of the lifting, just as it did in 2008 and 2022. Second, Seattle runs hot: the local line has sat above the national one for most of the past decade, it peaked higher in 2022 (10.1% vs 9.1%), and the current gap is about a point. Housing costs are the usual suspect in that persistent premium.
Reading notes, because this series has quirks. BLS surveys Seattle prices bimonthly — even months only — so the local line has half the resolution of the national one, and one recent point is simply missing (October 2025, a casualty of the federal shutdown). Both series are not seasonally adjusted, which is why we compare each month to the same month a year earlier rather than to the month before. And a city CPI measures price change within Seattle, not whether Seattle is cheaper or dearer than elsewhere — it answers “how fast,” never “how much.”
Source: U.S. Bureau of Labor Statistics, CPI-U, all items, not seasonally adjusted — Seattle-Tacoma-Bellevue (FRED CUURA423SA0) and U.S. city average (FRED CPIAUCNS). The June reading for both series lands with the CPI release in mid-July; this chart refreshes on the next daily build.