Seattle’s average wage: growing fast, still buying less than in 2019
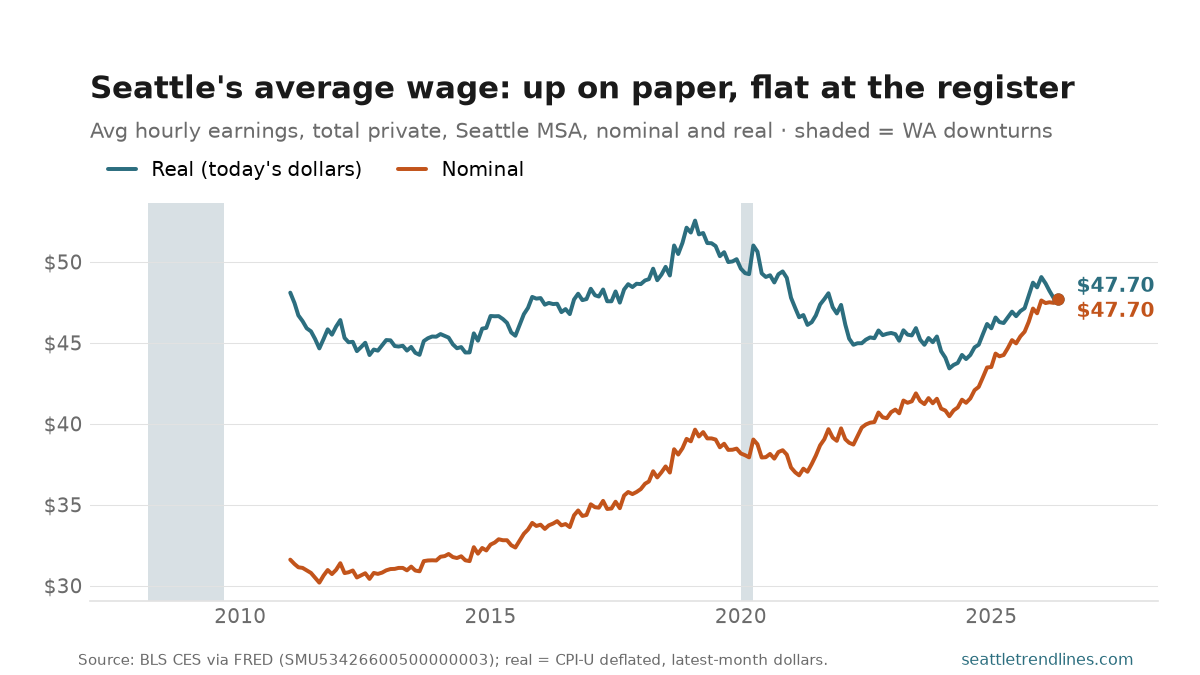
The average private-sector worker in the Seattle metro earned $47.70 an hour in May, up 6.8% from a year earlier — nominal wage growth that would have been front-page news any time in the 2010s. The teal line tells that story: pay up better than 50% since 2011, accelerating since late 2024.
The gray line tells the other one. Run the same series in today’s dollars and the average wage peaked in February 2019 at $52.55, was ground down 17% by the 2021–23 inflation to a trough of $43.42 in March 2024, and has since clawed back about 10%. Even after two years of unusually strong real gains — nominal growth near 7% against inflation near 4–5% — the average hour of work still buys about 9% less than it did in early 2019. That’s the whole inflation era in one picture: the raise arrived, and the register took it.
The caveats here are load-bearing, so read them. This is an average, not a median — it moves when the workforce changes shape, not just when anyone gets a raise. Some of the 2019 peak is exactly that: a tech-heavy boom pushing the mix upward, and some of the 2021 sag is low-wage hiring coming back. It’s also not seasonally adjusted and covers only private employees, and the series only begins in 2011. Direction and rough magnitude are trustworthy; any single month, less so. Pair it with the unemployment rate to see whether pay gains are coming from a tight labor market or a shrinking one.
Source: U.S. Bureau of Labor Statistics, State and Area Employment, Hours, and Earnings (CES), average hourly earnings of all employees, total private, Seattle-Tacoma-Bellevue WA MSA, not seasonally adjusted, via FRED series SMU53426600500000003. Real line deflated by U.S. CPI-U (CPIAUCNS) to the latest month. New months post about three weeks after month-end; this chart refreshes on the next daily build.