The region’s job machine has stalled
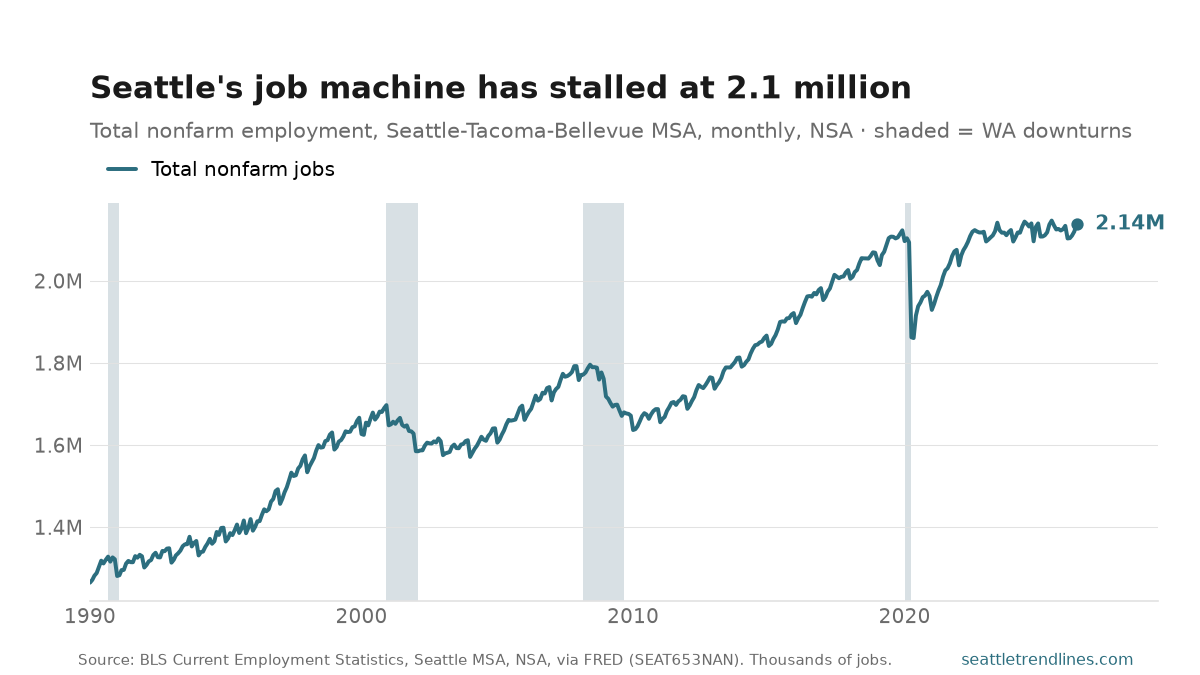
This is the region’s whole economic story on one line: 1.27 million jobs in 1990, 2.12 million now — the metro economy adding two-thirds again to its payrolls while the population grew to match. Every shock is legible. The dot-com flatline. The 2008–09 slide. The 2020 cliff — a quarter-million jobs gone in three months — followed by the fastest recovery on the chart. Even the October 2024 Boeing machinist strike shows up, a 44,000-job notch that snapped back the next month.
The right edge is the news, and the news is stillness. April’s count of 2,120,100 was up just 1,800 jobs — 0.1% — from a year earlier. Outside of recessions, this series simply doesn’t do that: year-over-year growth ran 2–3% through the 2010s and stayed positive even through the 2018–19 trade jitters. A flat year with unemployment still low reads as an economy at stall speed — not shedding workers, not hiring either. Whether that resolves into a downturn or a reacceleration is exactly what the next few months of this chart will show.
One reading note. The series is not seasonally adjusted, so the correct comparison is always to the same month a year ago — the annual sawtooth (summer peaks, January dips) is calendar, not economics. The NSA peak of 2,146,900 last June will likely be tested this summer; whether 2026 clears it is the cleanest single test of whether the stall is ending. For which industries are doing the stalling, see the jobs-by-sector breakdown.
Source: U.S. Bureau of Labor Statistics, State and Area Employment, Hours, and Earnings (CES), total nonfarm, Seattle-Tacoma-Bellevue WA MSA, not seasonally adjusted, via FRED series SEAT653NAN. Thousands of jobs, dated to the first of the month. New months post about three weeks after month-end; this chart refreshes on the next daily build.