The river Seattle drinks, July 2026
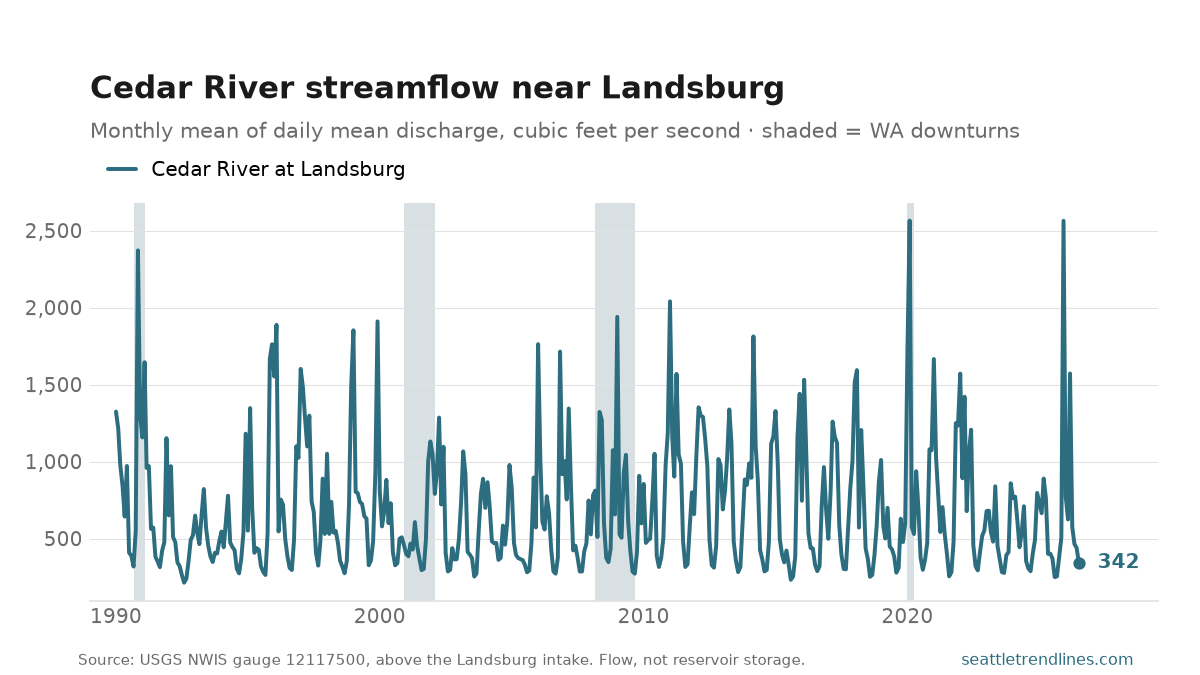
The Cedar River ran at 342 cubic feet per second in July 2026, measured just above the Landsburg intake that supplies about two thirds of Seattle’s drinking water. That is what arrives, before the city takes its share.
That is 85% of the July average, which is the only comparison worth making. This is a rain-and-snowmelt river, so the sawtooth in the chart is the season rather than the supply: every year is high in winter and low in September, and a wet January says nothing about whether there will be enough in August. Across 37 years, July has averaged 404 cfs — the driest was 263 (1992) and the wettest 674 (1997). The late-summer low is the number that decides anything, because that is when the city is living on what the winter banked.
This is half of the water-supply picture, and the missing half is storage. Chester Morse Lake and the Masonry Pool are what carry the city from the last of the snowmelt to the first autumn rain, and neither reservoir publishes a machine-readable level — so this post charts the flow and says plainly that it cannot tell you how full the tank is. The snowpack post upstream of this one is the other leading indicator, through the winter, and it runs December to May. Recent months are provisional and get revised.
Source: U.S. Geological Survey, NWIS daily values, gauge 12117500 (Cedar River near Landsburg, WA), monthly mean of daily mean discharge. Measured above the Landsburg intake, so it is inflow rather than what the city withdraws. Bench post — generated from the latest observation in the site database.