Seattle uses less water than it did in 1990 — with 44% more people
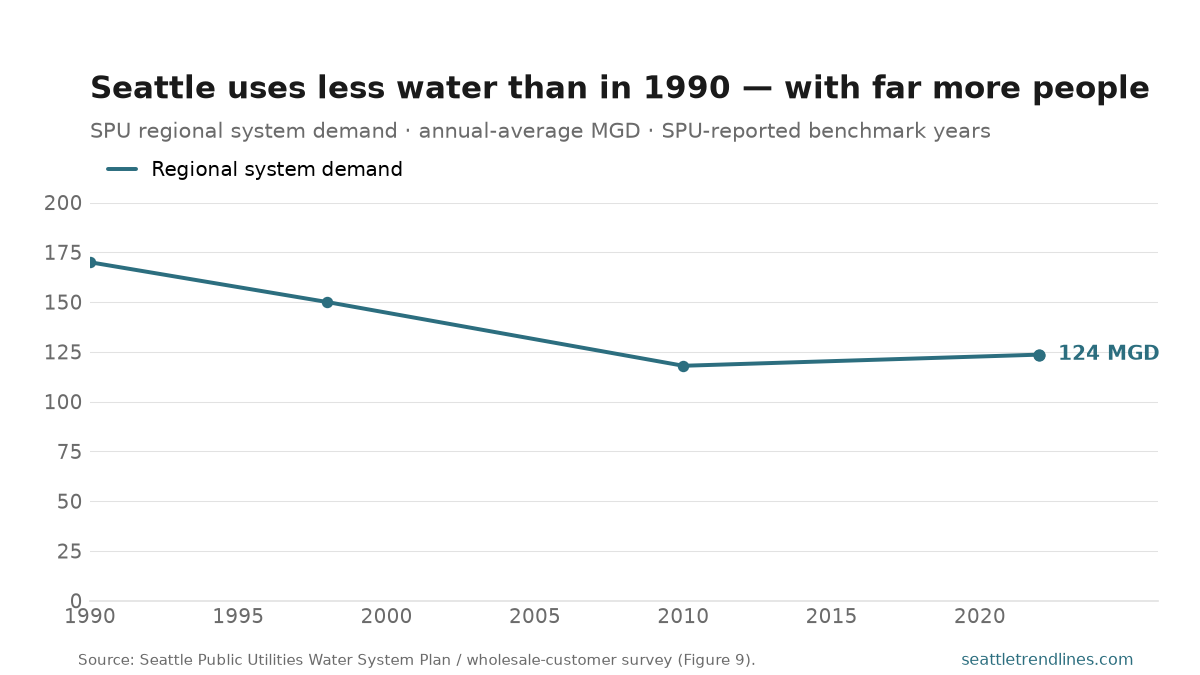
Most infrastructure stories in a growing city are about more: more housing, more transit, more power. Water is the exception. The Seattle regional system — the Cedar and Tolt supply that Seattle Public Utilities runs for about 1.5 million people across the metro — delivered roughly 170 million gallons a day in 1990. By 2022 it was down to about 124 even as the population it serves grew by around 44%. Total demand fell about 27% while the customer base swelled; per-person use is roughly half what it was in 1990. SPU’s own framing: the region now uses less water in total than it did in 1957.
The decline wasn’t gradual erosion so much as a step change that stuck. Demand sat on a plateau near 170 through the late 1980s, then the 1992 drought forced mandatory curtailment and broke the habit. What kept it broken was structural: the 1993 plumbing code (low-flow toilets, showerheads, and faucet aerators), progressively efficient appliances, a sustained regional conservation program, rising water rates that made waste expensive, and tighter system operations that cut leakage and reservoir overflow. Demand bottomed near 118 in 2010 and has drifted up only slightly since — into the low 120s — as population growth finally began to outrun the efficiency gains.
Why it matters beyond the utility bill: a region that added nearly half again as many people while cutting total water use has effectively manufactured new supply out of conservation, deferring the cost of new dams or bigger withdrawals — and leaving more water in the rivers, which is its own kind of dividend for the salmon. One honesty note on the chart: SPU publishes the full annual series only as a graphic, so the points plotted here are its reported figures at benchmark years, not a continuous meter read — the shape is right, the exact path between dots is SPU’s, not mine.
Source: Seattle Public Utilities — Water System Plan and annual wholesale-customer survey (Figure 9, Population & Components of Water Demand). Annual-average demand on the SPU regional supply system. SPU reports the full series only as a chart; values shown are its stated benchmark figures. Annual.