What share of Seattle works where, July 2026
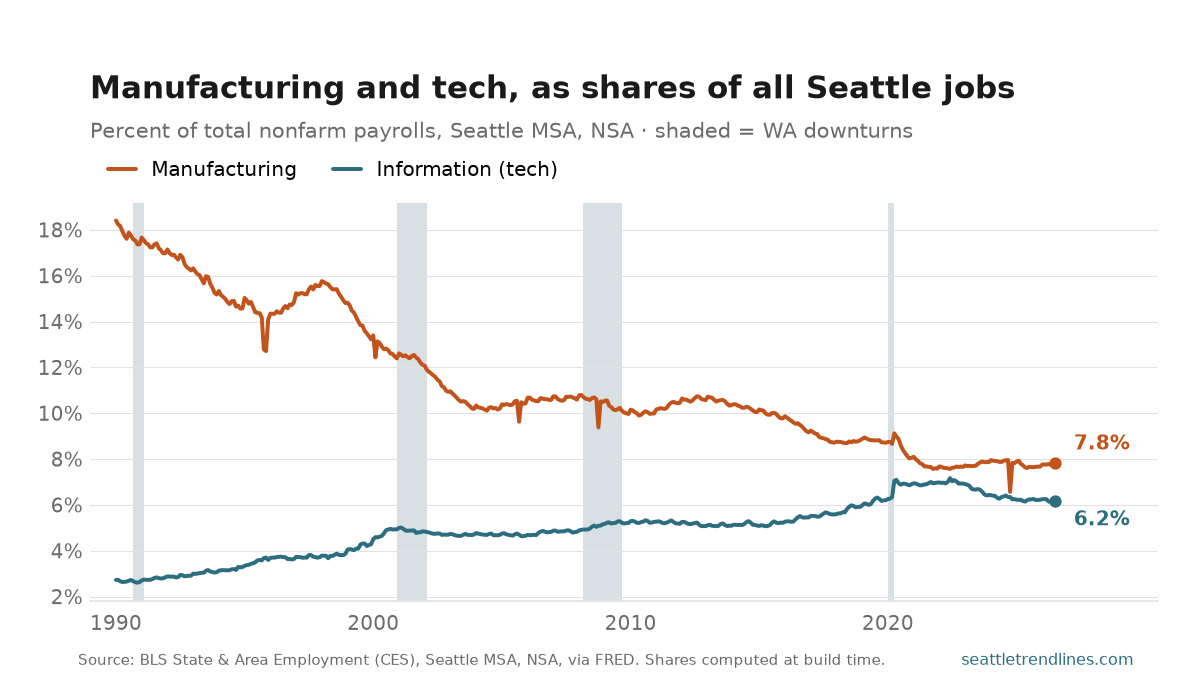
Information employers were 6.2% of all Seattle-metro payrolls in July 2026; manufacturers were 7.8%. In 1990 manufacturing was 18% and nothing else came close.
Tech versus aerospace charts these two as head counts, and head counts both grew for most of the period — which makes the transition look gentler than it was. As shares of a metro economy that roughly doubled in size, the picture is a straightforward substitution: one sector’s claim on the region’s payroll more than halved, the other’s roughly doubled, and they crossed.
‘Information’ is not ‘tech’, and the gap is large enough to matter. NAICS puts software publishers, telecoms and media in Information, but it classifies Amazon under retail and cloud infrastructure largely under other headings — so the real technology share of Seattle employment is well above 6.2%. Read the line as a floor and, more usefully, as a trend: the classification has been consistent throughout, so the shape is right even where the level understates.
Both series are the same BLS metro release, so numerator and denominator are revised together and the share stays internally consistent. Not seasonally adjusted; the single-month notches in manufacturing are Boeing machinist strikes.
Source: U.S. Bureau of Labor Statistics, State & Area Employment (CES), Seattle–Tacoma–Bellevue MSA, not seasonally adjusted, via FRED (SEAT653INFON, SEAT653MFGN, SEAT653NAN). Each share is the sector divided by total nonfarm payrolls, computed at build time rather than stored. Auto-generated each build.