Seattle inflation against the country, August 2026
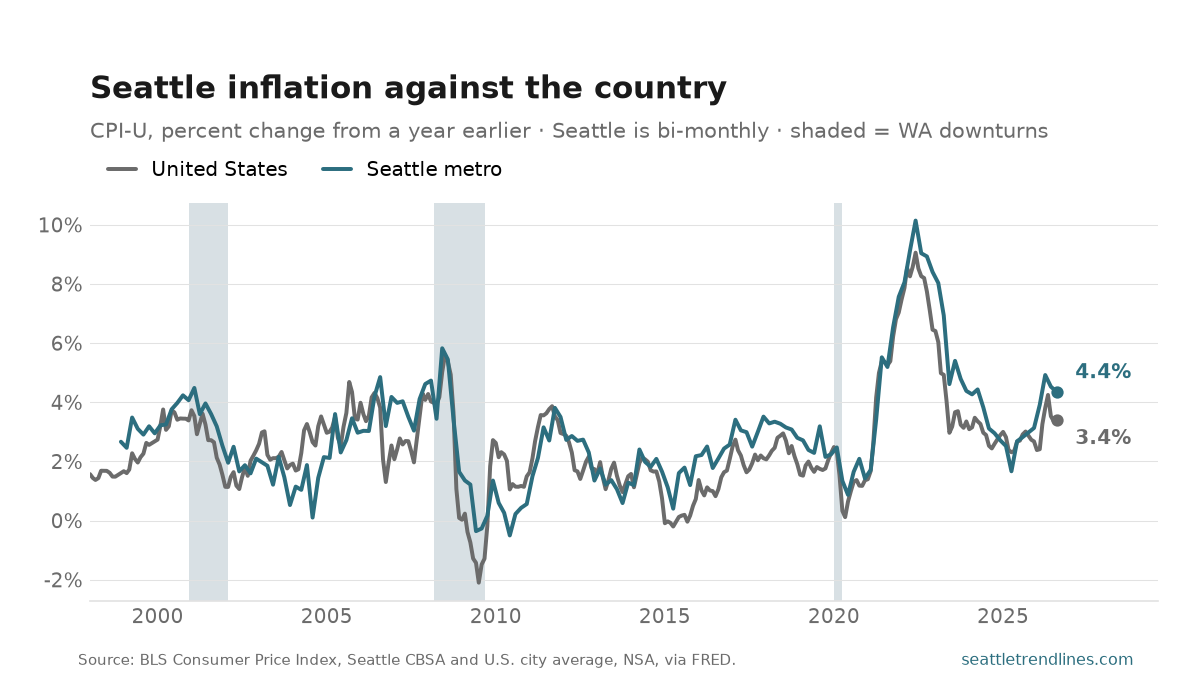
Seattle-metro prices were 4.4% higher than a year earlier in August 2026; nationally the figure was 3.4%. The gap is 1.0 points, with Seattle running hotter this month.
Most of what sets inflation is national — energy, vehicles, the money supply — so the two lines mostly move together and the interesting number is the distance between them. What opens that distance is housing: shelter is roughly a third of the basket and by far its most local component, which is why asking rents lead this gap by about a year.
BLS publishes the Seattle index for even months only, against a monthly national one, which is why this post runs every other month rather than every month: on the months in between there is no new local reading to report, only the one you are looking at here. The chart starts in 1998; the index itself goes back to 1914, when this was a different city.
Source: U.S. Bureau of Labor Statistics, Consumer Price Index for All Urban Consumers, Seattle–Tacoma–Bellevue CBSA (bi-monthly) and the U.S. city average, not seasonally adjusted, via FRED. Auto-generated each build.