Buy or rent: the Seattle ratio, August 2026
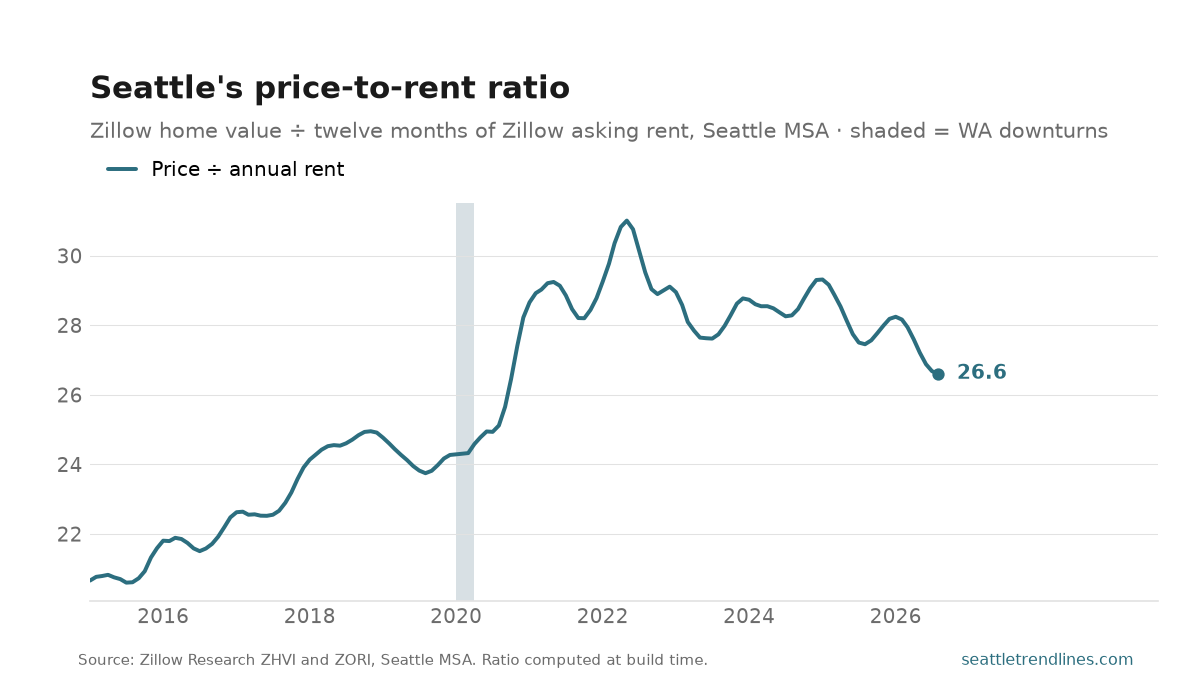
The typical Seattle-area home was worth $727,359 in August 2026, and the typical asking rent was $2,278 a month. Divide the first by a year of the second and you get the price-to-rent ratio: 26.6. A Seattle house costs about 27 years of the rent on it.
It is the cleanest single number for whether housing is expensive relative to itself. Prices and rents are both driven by local incomes and local supply, so when they rise together the ratio holds flat and the market is simply pricier; when prices pull away from rents, buyers are paying for something other than the shelter — expected appreciation, or cheap credit. Nationally a ratio in the high teens is typical. Seattle’s has run from 13.8 (January 2000) to 31.0 (May 2022), and it is 26.6 now, down 3.1% on the year.
Two things it is not. It is not a buy-versus-rent recommendation: that depends on mortgage rates, the tax treatment of the interest, and how long you stay, none of which is in here. And the two legs measure slightly different housing — ZHVI values the whole owner-occupied stock, ZORI tracks asking rents on units coming to market, which skew smaller and newer. The level is therefore approximate; the direction is the signal.
Source: Zillow Research, Zillow Home Value Index and Zillow Observed Rent Index, Seattle–Tacoma–Bellevue MSA. The ratio is ZHVI ÷ (ZORI × 12), computed from the two series at build time rather than stored. Auto-generated each build.