Seattle’s immigrants increasingly live outside Seattle
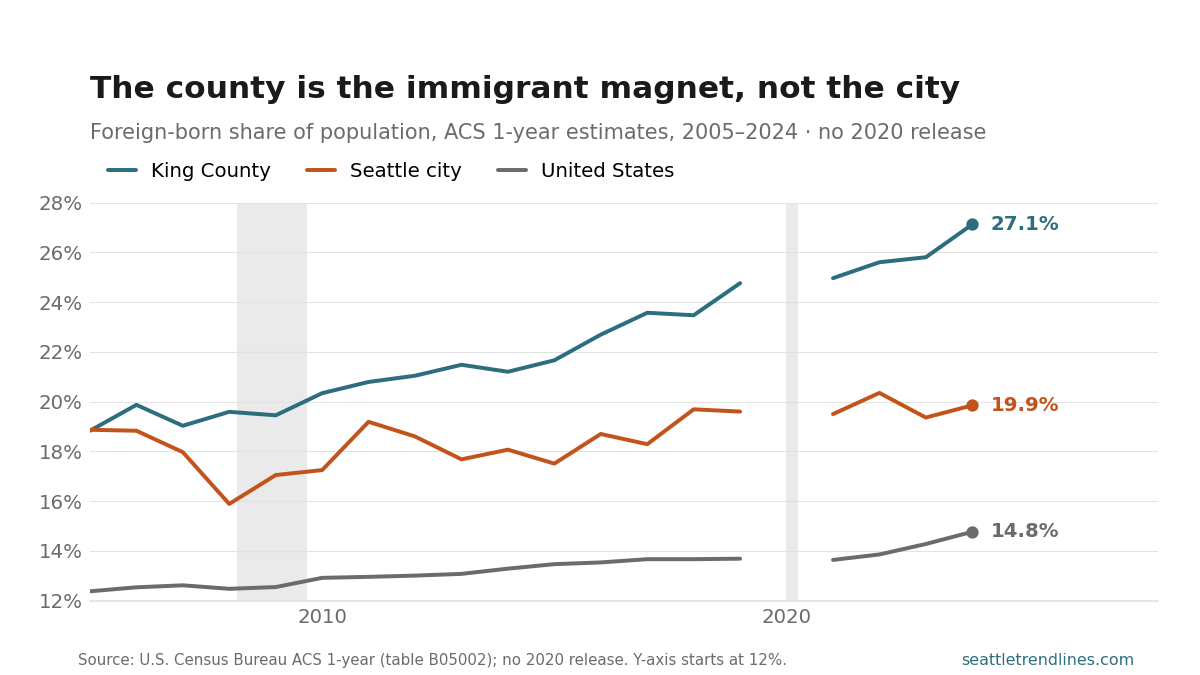
A quarter-century ago, the city of Seattle was the more immigrant-heavy place: 16.9% foreign born in the 2000 Census, against 15.4% for King County as a whole. That ordering has reversed and then some. By 2024, King County reached 27.1% foreign born — up from 25.8% the year before and from 18.8% when the annual ACS began in 2005. The county’s foreign-born share is now nearly double the national figure (14.8%).
The city of Seattle did not come along for the ride. Its foreign-born share has wandered in a flat band — roughly 18% to 20% for two decades — and sits at 19.9% in 2024, barely above its 2005 reading. (The single-year city estimates are noisy; the 2008 dip to 15.9% is sampling wobble, not an exodus.) The widening gap between the two lines is the whole story: the people moving in are settling on the Eastside — Bellevue, Redmond, Sammamish — and across south King County — Kent, SeaTac, Federal Way, Tukwila — not inside the city limits.
This is the demographic counterpart to the median-age split: the suburban ring, not the core, is where the county is changing fastest.
Source: U.S. Census Bureau, American Community Survey 1-year estimates — Place of Birth by Nativity, table B05002 (foreign born B05002_013E ÷ total B05002_001E), for Seattle city, King County, and the United States. The 2000 figures are from Census 2000 SF3 (table P021). There is no standard ACS 1-year release for 2020. One-year estimates for a single city or county carry meaningful sampling error — read the trend, not the year-to-year wiggle. State downturns: Philadelphia Fed Coincident Economic Activity Index for Washington. The 2024 ACS 1-year was released in September 2025; the 2025 vintage is due around September 2026.